crested.pl.region.scatter#
- crested.pl.region.scatter(adata, region, model_names=None, log_transform=False, annotate_top=5, top_method='sum', square=True, identity_line=False, plot_kws=None, annotate_kws=None, ax=None, **kwargs)#
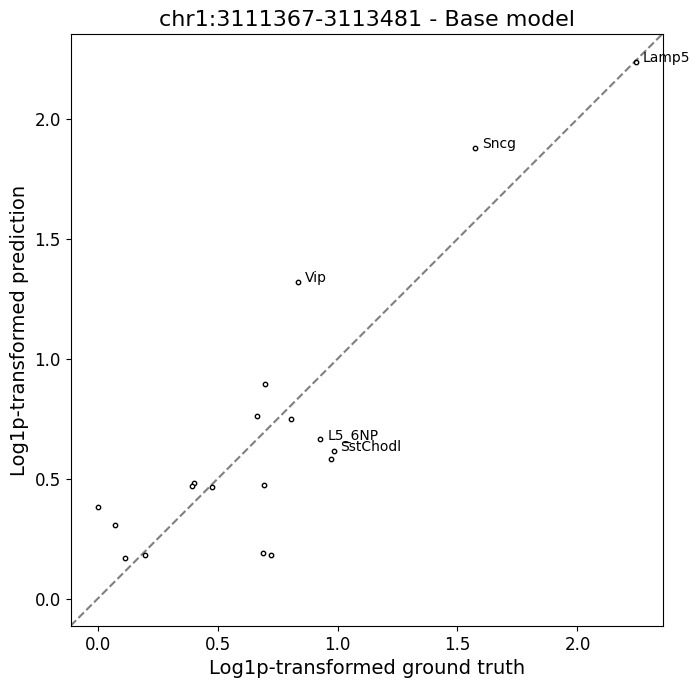
Scatterplot of ground truths and predictions for a specific region in your data, comparing different classes.
- Parameters:
adata (
AnnData) – AnnData object containing the genomic data invar.region (
str) – Region name from the AnnData, generally in format ‘chr:start-end’.model_names (
str|list[str] |None(default:None)) – The target to plot the distribution for, either None (to plot all) or one/multiple names of a prediction layer in adata.layers.log_transform (
bool(default:False)) – Whether to apply a log1p transformation to the data.annotate_top (
int|None(default:5)) – Number of top classes to annotate with their class names. If None, does not annotate any.top_method (
Literal['sum','truth','pred'] (default:'sum')) – How to determine the top n classes. “truth” or “pred” use highest on either, “sum” takes highest sum of both.square (
bool(default:True)) – Whether to force the plots to be square, have equal aspect ratios, and equal shared axis ranges.identity_line (
bool(default:False)) – Whether to plot a y=x line denoting perfect correlation.plot_kws (
dict|None(default:None)) – Extra keyword arguments passed toscatter(). Defaults:'s': 10,'color': 'white','edgecolor': 'black'.annotate_kws (
dict|None(default:None)) – Extra keyword arguments passed toannotate(). Defaults:'xytext': (5, 0),'textcoords': 'offset points'ax (
Axes|None(default:None)) – Axis to plot values on. If not supplied, creates a figure from scratch.width – Width of the newly created figure if
ax=None. Default is 7*n_models.height – Height of the newly created figure if
ax=None. Default is 7.sharex – Whether to share the x axes of the created plots. Default is False. Setting
square=Truedoes equalize limits even ifsharex=Falsesharey – Whether to share the y axes of the created plots. Default is False. Setting
square=Truedoes equalize limits even ifsharey=False.kwargs – Additional arguments passed to
render_plot()to control the final plot output. Please seerender_plot()for details. Custom defaults forregion:xlabel="Ground truth",ylabel="Prediction", `title="region",layout="compressed",title="{region}-{model_name}"`(1 model)/`model_name`(>1 model), `suptitle=region(>1 model).
- Return type:
See also
Example
>>> crested.pl.region.scatter(
...     adata,
...     "chr1:3111367-3113481",
...     model_names='Base model',
...     log_transform=True,
...     identity_line=True,
... )