crested.pl.region.bar#
- crested.pl.region.bar(data, region=None, model_names=None, classes=None, log_transform=False, pred_color='tab:blue', truth_color='green', plot_kws=None, ax=None, adata='deprecated', target='deprecated', **kwargs)#
Barplot of ground truths and/or predictions for a specific region in your data.
Can plot either a region from an AnnData (
data=adata, region=region) or manual prediction (data=pred, classes=adata.obs_names). When plotting from AnnData, can plot the ground truth and any available predictions.- Parameters:
data (
AnnData|ndarray) – AnnData object containing the genomic data invar(requiring theregionargument), or single prediction numpy array (requiring theclassesargument).region (
str|None(default:None)) – Region name from the AnnData, generally in format ‘chr:start-end’. Required if providing an AnnData object.model_names (
str|list[str] |None(default:None)) – Source of the values to plot, as a name or list of names. Can be ‘X’/’truth’/’groundtruth’ for the ground truth from adata.X, or the name of prediction layers in adata.layers. If None, plots the ground truth and all layers in the AnnData. Disregarded if plotting a single prediction.classes (
list[str] |None(default:None)) – The class names to use. Required if providing a single prediction. If using an AnnData object, read from there by default.log_transform (
bool(default:False)) – Whether to apply a log1p transformation to the data.pred_color (
str(default:'tab:blue')) – Plot color of any prediction barplot.truth_color (
str(default:'green')) – Plot color of any ground truth barplot.plot_kws (
dict|None(default:None)) – Extra keyword arguments passed tobar(). Defaults:'alpha': 0.8.ax (
Axes|None(default:None)) – Axis to plot values on. If not supplied, creates a figure from scratch.width – Width of the newly created figure if
ax=None. Default is 18.height – Height of the newly created figure if
ax=None. Default is 4*n_model_names.kwargs – Additional arguments passed to
render_plot()to control the final plot output. Please seerender_plot()for details. Custom defaults forregion:title='Ground truth'/target,'color'=['tab:blue'`(for predictions)/’green’(for ground truth)]`,suptitle=region,ylabel="Ground truth"/"Prediction,grid='y'.
- Return type:
Example
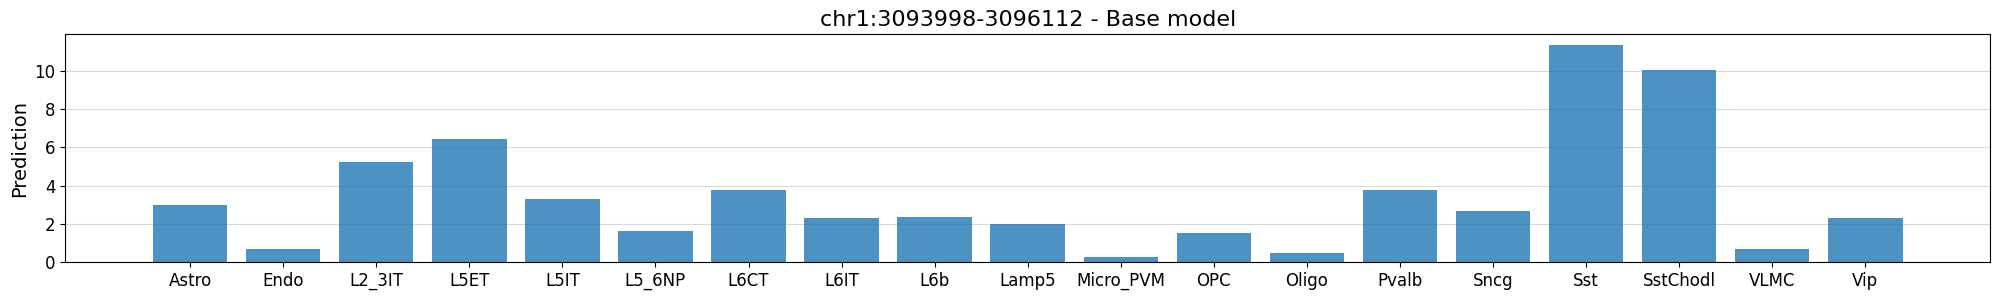
>>> crested.pl.region.bar(
...     adata,
...     region='chr1:3093998-3096112',
...     model_names="Base model",
...     width=20,
...     height=3
... )
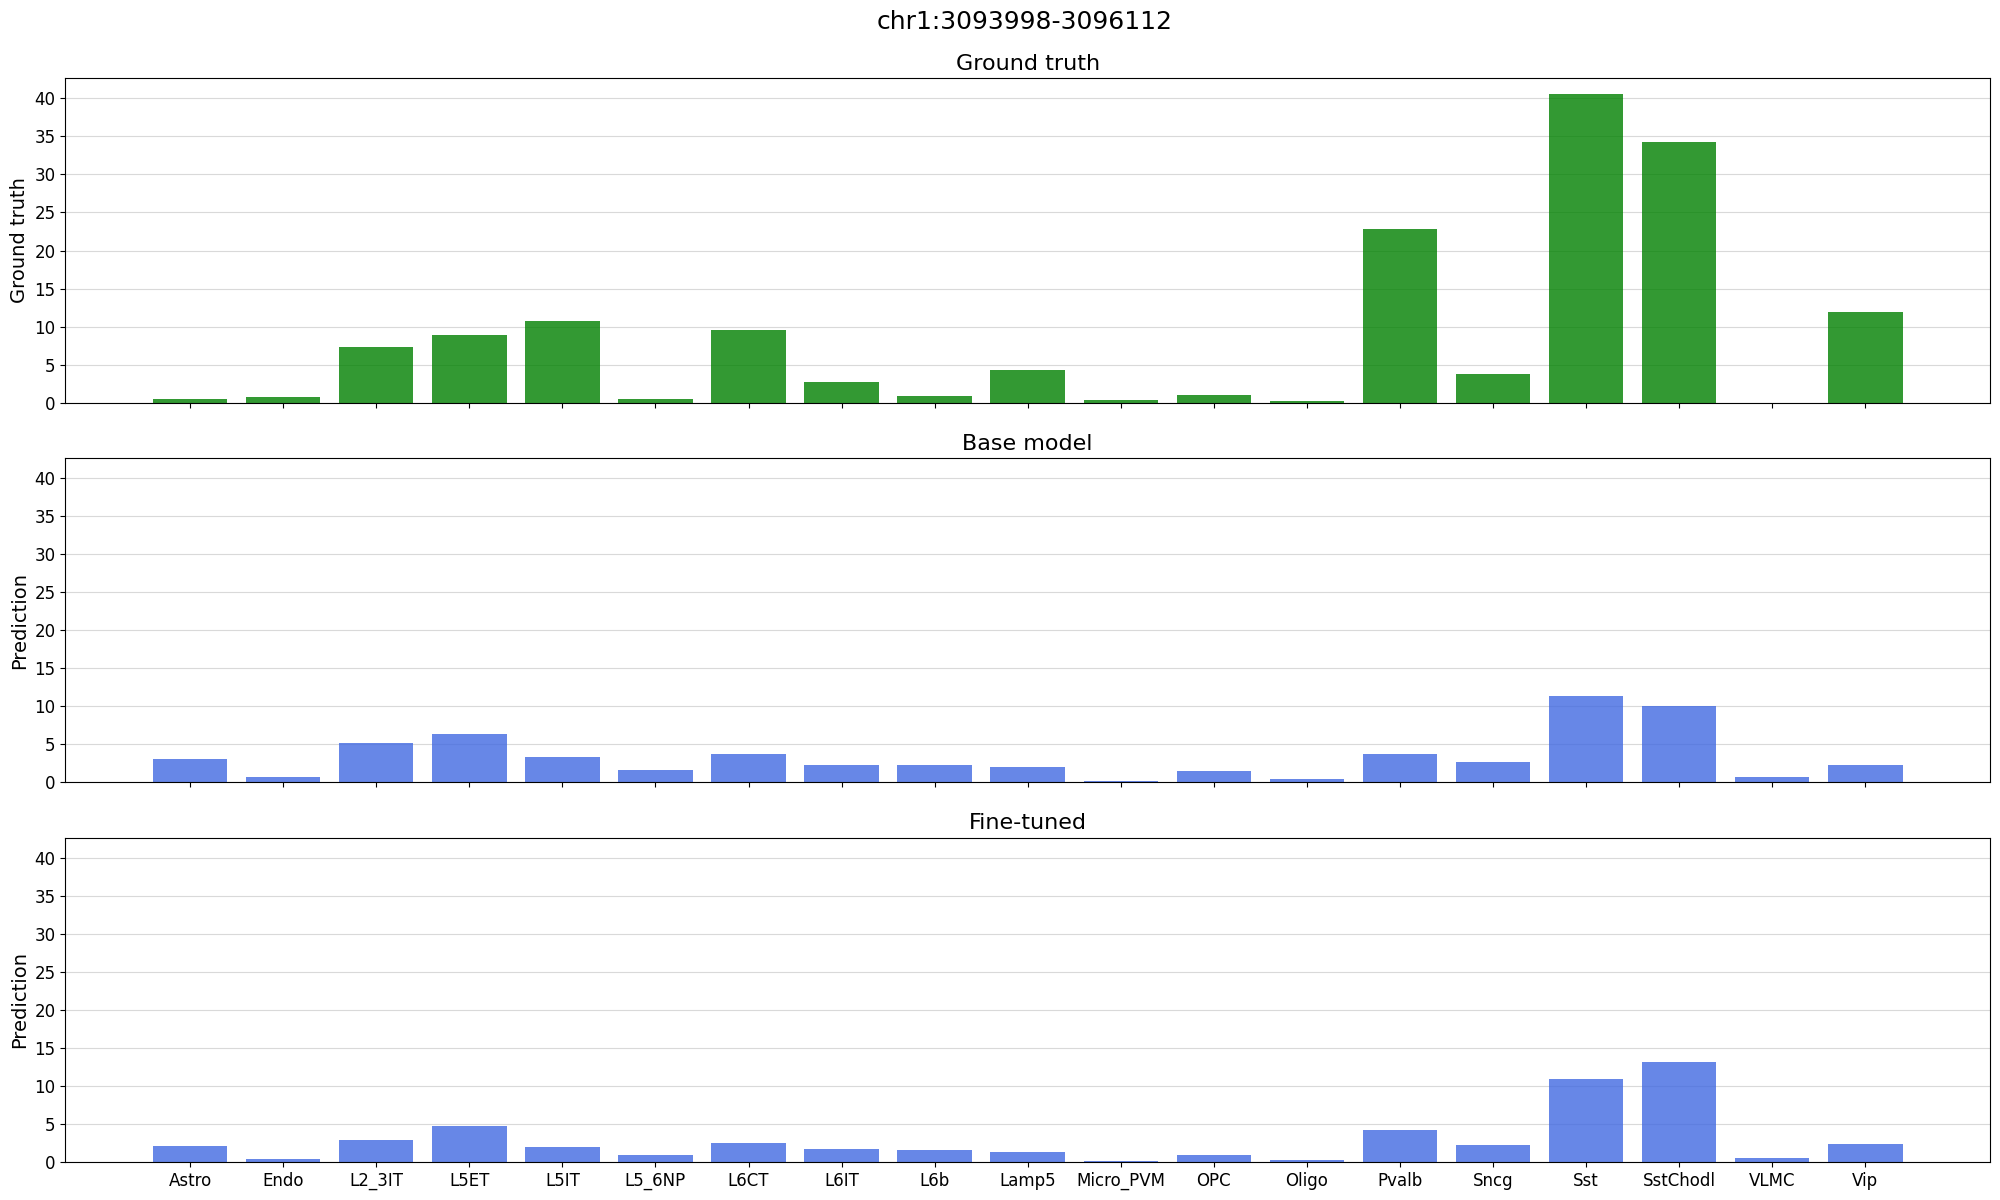
>>> crested.pl.region.bar(
...     adata,
...     region="chr1:3093998-3096112",
...     pred_color="royalblue",
...     width=20,
... )
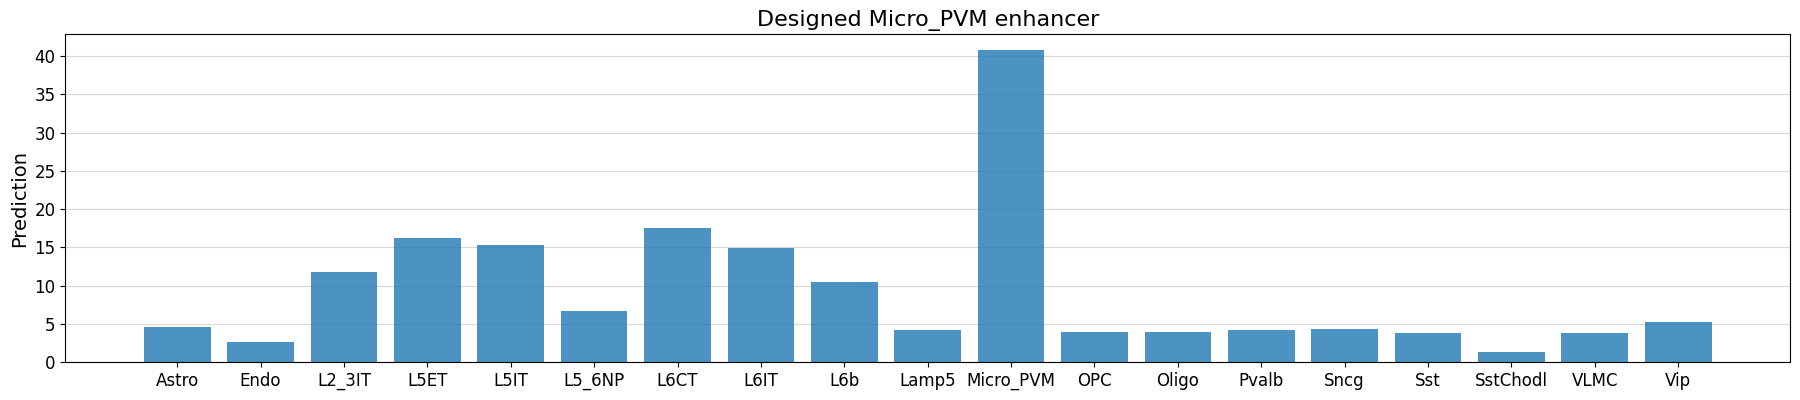
>>> crested.pl.region.bar(
...     pred,
...     classes=adata.obs_names,
...     title="Designed Micro-PVM enhancer",
... )