crested.pl.explain.contribution_scores#
- crested.pl.explain.contribution_scores(scores, seqs_one_hot, sequence_labels=None, class_labels=None, zoom_n_bases=None, coordinates=None, highlight_positions=None, method=None, plot_kws=None, highlight_kws=None, sharey='sequence', ax=None, **kwargs)#
Visualize interpretation scores with optional highlighted positions.
Contribution scores can be calculated using the
contribution_scores()method.- Parameters:
scores (
ndarray) – Contribution scores of shape (n_seqs, n_classes, n_bases, n_features).seqs_one_hot (
ndarray) – One-hot encoded corresponding sequences of shape (n_seqs, n_bases, n_features).sequence_labels (
str|list[str] |None(default:None)) – Label or list of sequence labels (subplot titles) to add to the plot. Should have the same length as the number of sequences.class_labels (
str|list[str] |None(default:None)) – Label or list of class labels to add to the plot. Should have the same length as the number of classes.zoom_n_bases (
int|None(default:None)) – Number of center bases to zoom in on. Default is None (no zooming).coordinates (
str|tuple|list[str] |list[tuple] |None(default:None)) – Optional, a (list of) string or tuple of coordinates that are being plotted between per sequence, to set the x coordinates. Every entry can be a parsable chr:start-region(:strand) string, or a tuple with ((chr), start, end, (strand)), with chr and strand being optional. If strand is provided and ‘-’, runs the x coordinates from end to start, as expected with a negative strand region.highlight_positions (
tuple[int,int] |list[tuple[int,int]] |None(default:None)) – List of tuples with start and end positions to highlight. Default is None. Positions are within the full sequence length before zooming, or optionally genomic values if usingcoordinates.method (
Optional[Literal['mutagenesis','mutagenesis_letters']] (default:None)) – Default is None (for gradient-based contributions). If plotting mutagenesis values, set to'mutagenesis_letters'(to visualize average effects as letters) ormutagenesis(to visualize in a legacy way).plot_kws (
dict|None(default:None)) – Extra keyword arguments passed to the underlying plotting function. IfmethodisNoneor'mutagenesis_letters', passed to_plot_attribution_mapand on tologomaker.Logo. Ifmethodis'mutagenesis', passed to_plot_mutagenesis_mapand on tobar().highlight_kws (
dict|None(default:None)) – Keywords to use for plotting highlights withaxvspan(). Default is {‘edgecolor’: “red”, ‘facecolor’: “none”, ‘linewidth’: 0.5}sharey (
Literal['sequence',True,False] (default:'sequence')) – Whether to share the y axes of the created plots. Default is ‘sequence’, which shared between classes for one sequence but not between sequences.ax (
Axes|None(default:None)) – Axis to plot values on. If not supplied, creates a figure from scratch.width – Width of the newly created figure if
ax=None. Default is n_bases//10.height – Height of the newly created figure if
ax=None. Default is 0.5+2.25*n_seqs*n_classes.sharex – Whether to share the x axes of the created plots. Default is False.
kwargs – Additional arguments passed to
render_plot()to control the final plot output. Please seerender_plot()for details. Custom defaults forcontribution_scores:ylabel='Scores',h_pad=0.2(forcreate_plot()).
- Return type:
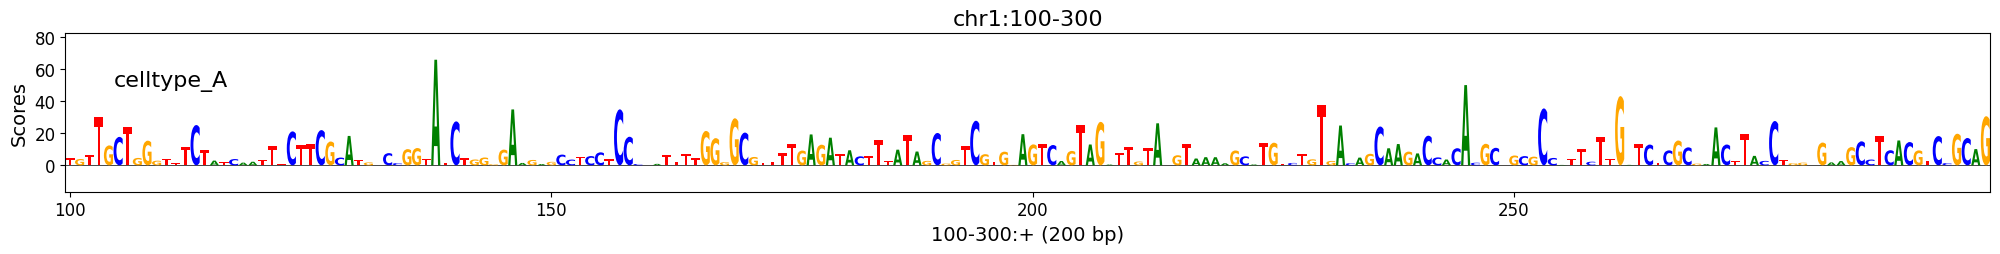
Examples
>>> import numpy as np
>>> scores = np.random.exponential(10, (1, 1, 200, 4))
>>> seqs_one_hot = np.eye(4)[None, np.random.randint(4, size=200)]
>>> class_of_interest = "celltype_A"
>>> region_of_interest = "chr1:100-300"
>>> crested.pl.explain.contribution_scores(
...     scores=scores,
...     seqs_one_hot=seqs_one_hot,
...     sequence_labels=region_of_interest,
...     class_labels=class_of_interest,
...     coordinates=region_of_interest
... )