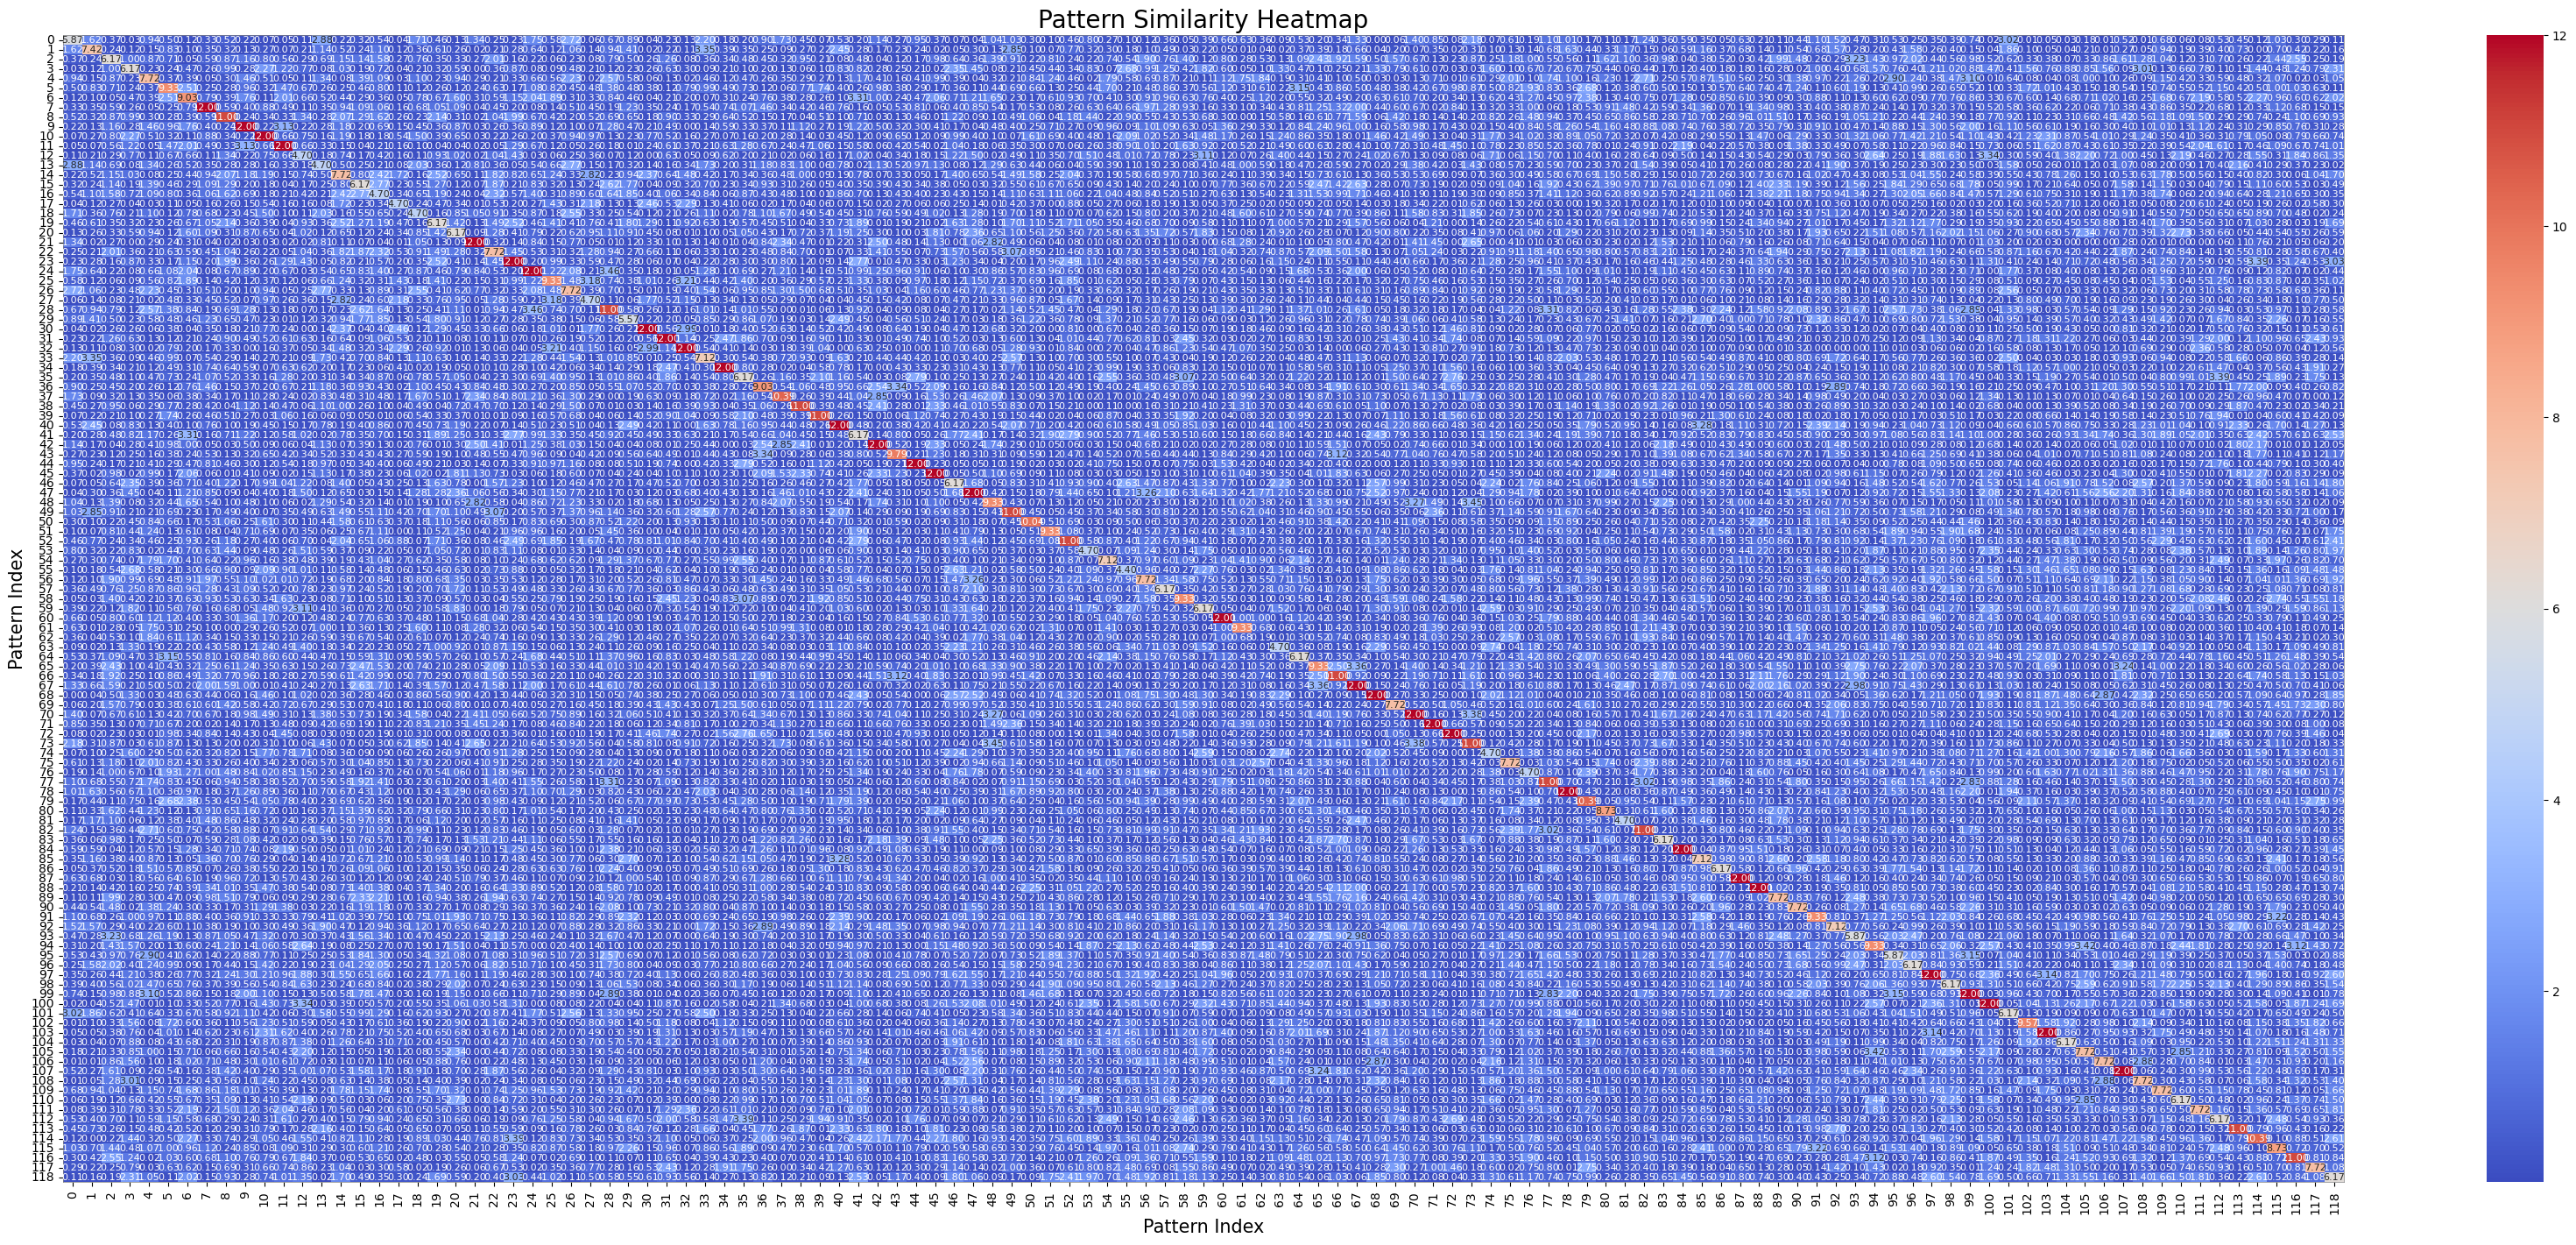
crested.pl.modisco.similarity_heatmap#
- crested.pl.modisco.similarity_heatmap(similarity_matrix, indices, cmap='coolwarm', plot_kws=None, ax=None, fig_size='deprecated', fig_path='deprecated', **kwargs)#
Plot a similarity heatmap of all pattern indices.
- Parameters:
similarity_matrix (
ndarray) – A 2D numpy array containing the similarity values.indices (
list) – List of pattern indices.cmap (
str|Colormap(default:'coolwarm')) – Colormap to use.plot_kws (
dict|None(default:None)) – Extra keyword arguments passed toheatmap(). Adjusted defaults compared to the base function are{'annot': True, 'fmt': '.2f', 'annot_kws': {'size': 8}, 'xticklabels': indices, 'yticklabels': indices}.ax (
Axes|None(default:None)) – Axis to plot values on. If not supplied, creates a figure from scratch.width – Width of the newly created figure if
ax=None. Default is 30.height – Height of the newly created figure if
ax=None. Default is 15.kwargs – Additional arguments passed to
render_plot()to control the final plot output. Please seerender_plot()for details. Adjusted defaults forsimilarity_heatmap:title="Pattern similarity heatmap",title_fontsize=20,[x/y]label='Pattern index',[x/y]label_fontsize=15
- Return type:
Examples
>>> sim_matrix, indices = crested.tl.modisco.calculate_similarity_matrix(
...     all_patterns
... )
>>> crested.pl.modisco.similarity_heatmap(sim_matrix, indices, fig_size=(42, 17))