crested.pl.modisco.clustermap#
- crested.pl.modisco.clustermap(pattern_matrix, classes, subset=None, grid=False, cmap='coolwarm', center=0, method='average', dy=0.002, save_path=None, pat_seqs=None, dendrogram_ratio=(0.05, 0.2), importance_threshold=0, plot_kws=None, width=25, height=8, figsize='deprecated')#
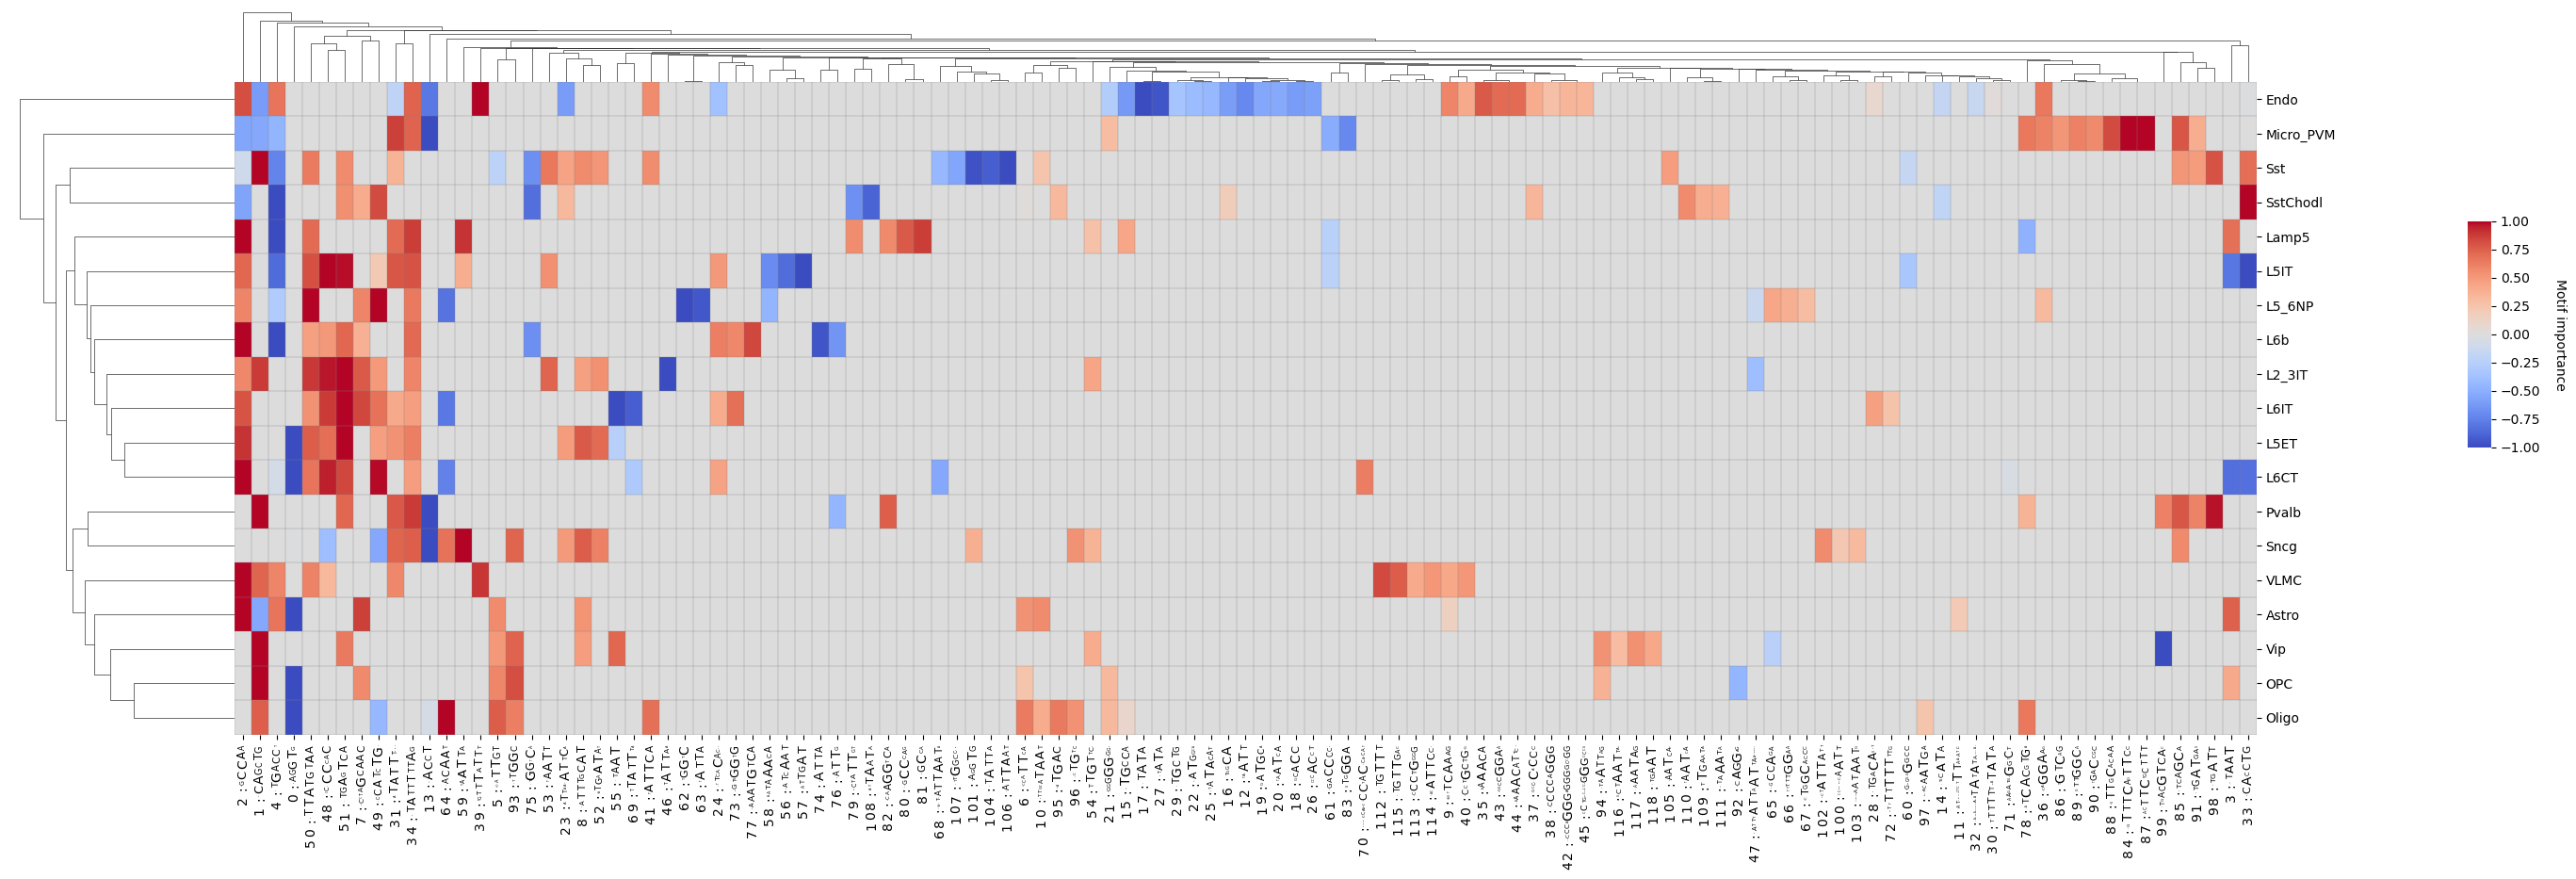
Create a clustermap from the given pattern matrix and class labels with customizable options.
- Parameters:
pattern_matrix (
ndarray) – 2D NumPy array containing pattern data.classes (
list[str]) – List of class labels, matching the rows of the pattern matrix.subset (
list[str] |None(default:None)) – List of class labels to subset the matrix.grid (
bool(default:False)) – Whether to add a grid to the heatmap.cmap (
str(default:'coolwarm')) – Colormap for the clustermap.center (
float(default:0)) – Value at which to center the colormap.method (
str(default:'average')) – Clustering method to use.dy (
float(default:0.002)) – Scaling parameter for vertical distance between nucleotides (if pat_seqs is not None) in xticklabels.save_path (
str|None(default:None)) – Path to save the figure.pat_seqs (
list[tuple[str,ndarray]] |None(default:None)) – List of sequences to use as xticklabels.dendrogram_ratio (
tuple[float,float] (default:(0.05, 0.2))) – Ratio of dendograms in x and y directions.importance_threshold (
float(default:0)) – Minimal pattern importance threshold over all classes to retain the pattern before clustering and plotting.plot_kws (
dict|None(default:None)) – Extra keyword arguments passed toclustermap(). Default is{'cbar_pos': (1.05, 0.4, 0.01, 0.3)}.
- Return type:
ClusterGrid
Examples
>>> pat_seqs = crested.tl.modisco.generate_nucleotide_sequences(all_patterns)
>>> crested.pl.modisco.clustermap(
...     pattern_matrix,
...     classes=list(adata.obs_names)
...     subset=["Lamp5", "Pvalb", "Sst", "Sst-Chodl", "Vip"],
...     figsize=(25, 8),
...     grid=True,
... )