crested.pl.locus.locus_scoring#
- crested.pl.locus.locus_scoring(scores, coordinates=None, gene_start=None, gene_end=None, bigwig_values=None, bigwig_midpoints=None, highlight_positions=None, locus_plot_kws=None, bigwig_plot_kws=None, highlight_kws=None, ax=None, **kwargs)#
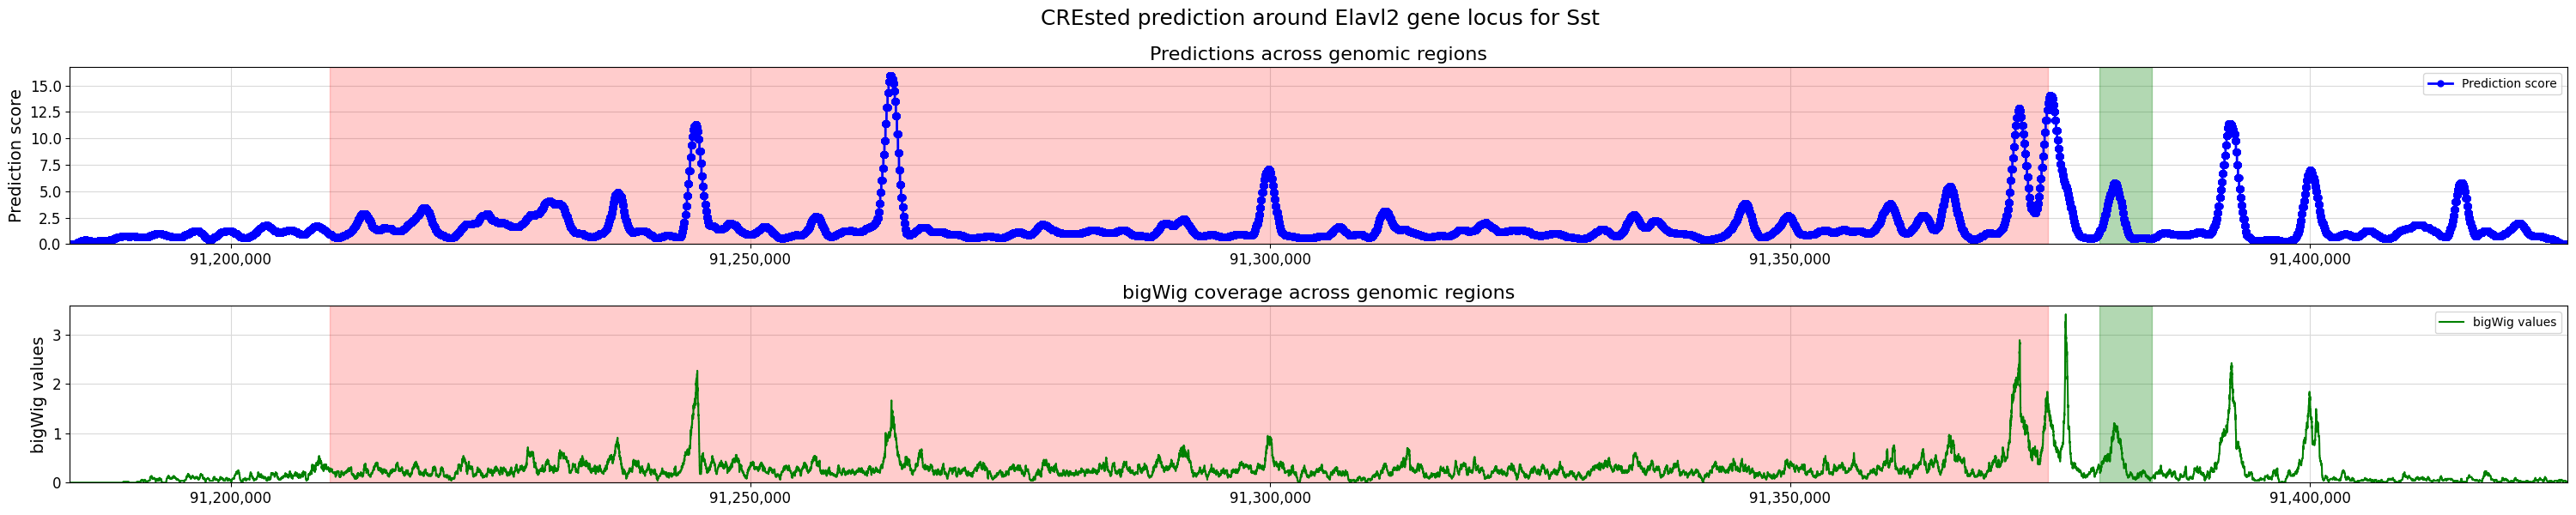
Plot model predictions over a genomic locus from
score_gene_locus()and optionally indicate the gene body.Also plots values from a bigWig file if provided.
- Parameters:
scores (
ndarray) – An array of prediction scores for each window.coordinates (
str|tuple(default:None)) – A string or tuple of coordinates that are being plotted between, to set the x coordinates. Can be a parsable chr:start-region(:strand) string, or a tuple with ((chr), start, end, (strand)), with chr and strand being optional. Will ignore the chromosome and strand, if provided.gene_start (
int|None(default:None)) – The start position of the gene locus to highlight on the plot.gene_end (
int|None(default:None)) – The end position of the gene locus to highlight on the plot.ylim – Manually set the y-range of the plot.
bigwig_values (
ndarray|None(default:None)) – A numpy array of values extracted from a bigWig file for the same coordinates.bigwig_midpoints (
list[int] |None(default:None)) – A list of base pair positions corresponding to the bigwig_values.highlight_positions (
list[tuple[int,int]] |None(default:None)) – A list of tuples specifying ranges to highlight on the plot.locus_plot_kws (
dict|None(default:None)) – Extra keyword arguments passed toplot()for the prediction plot. Defaults:{'markersize': 5.0, 'linewidth': 2.0, 'color': 'b', 'marker': 'o', 'label': 'Prediction score', 'rasterized': True}.bigwig_plot_kws (
dict|None(default:None)) – Extra keyword arguments passed toplot()for the bigWig plot. Defaults:{'color': 'b', 'linestyle'='-', 'label': 'bigWig values', 'rasterized': True}.highlight_kws (
dict|None(default:None)) – Keywords to use for plotting highlights withaxvspan(). Default is {‘color’: “green”, ‘alpha’: 0.3}ax (
Axes|None(default:None)) – Axis to plot values on. If not supplied, creates a figure from scratch. Can only be supplied if not plotting a bigWig.width – Width of the newly created figure if
ax=None. Default is 30.height – Height of the newly created figure if
ax=None. Default is 3 without or 6 with a bigWig plot.sharex – Whether to share the x axes of the created plots. Default is True.
sharey – Whether to share the y axes of the created plots. Default is True.
kwargs – Additional arguments passed to
render_plot()to control the final plot output. Please seerender_plot()for details. Custom defaults forlocus_scoring:grid='both',xlabel='Genomic position',title='Predictions across genomic regions'(, "bigWig coverage across genomic regions"),ylabel='Prediction_score'(, 'bigWig values').
- Return type:
Example
>>> crested.pl.locus.locus_scoring(
...     scores,
...     coordinates=(min_loc, max_loc),
...     gene_start=start,
...     gene_end=end,
...     bigwig_values=bw_values,
...     bigwig_midpoints=midpoints,
...     highlight_positions = [(max_loc-45000, max_loc-40000)],
...     suptitle="CREsted prediction around Elavl2 gene locus for Sst"
... )