crested.pl.design.step_contribution_scores#
- crested.pl.design.step_contribution_scores(intermediate, scores_all, seqs_one_hot_all, sequence_labels=None, class_labels=None, zoom_n_bases=None, ylim=None, global_ylim='per_plot', method=None, highlight_kws=None, show=True, labels='deprecated', **kwargs)#
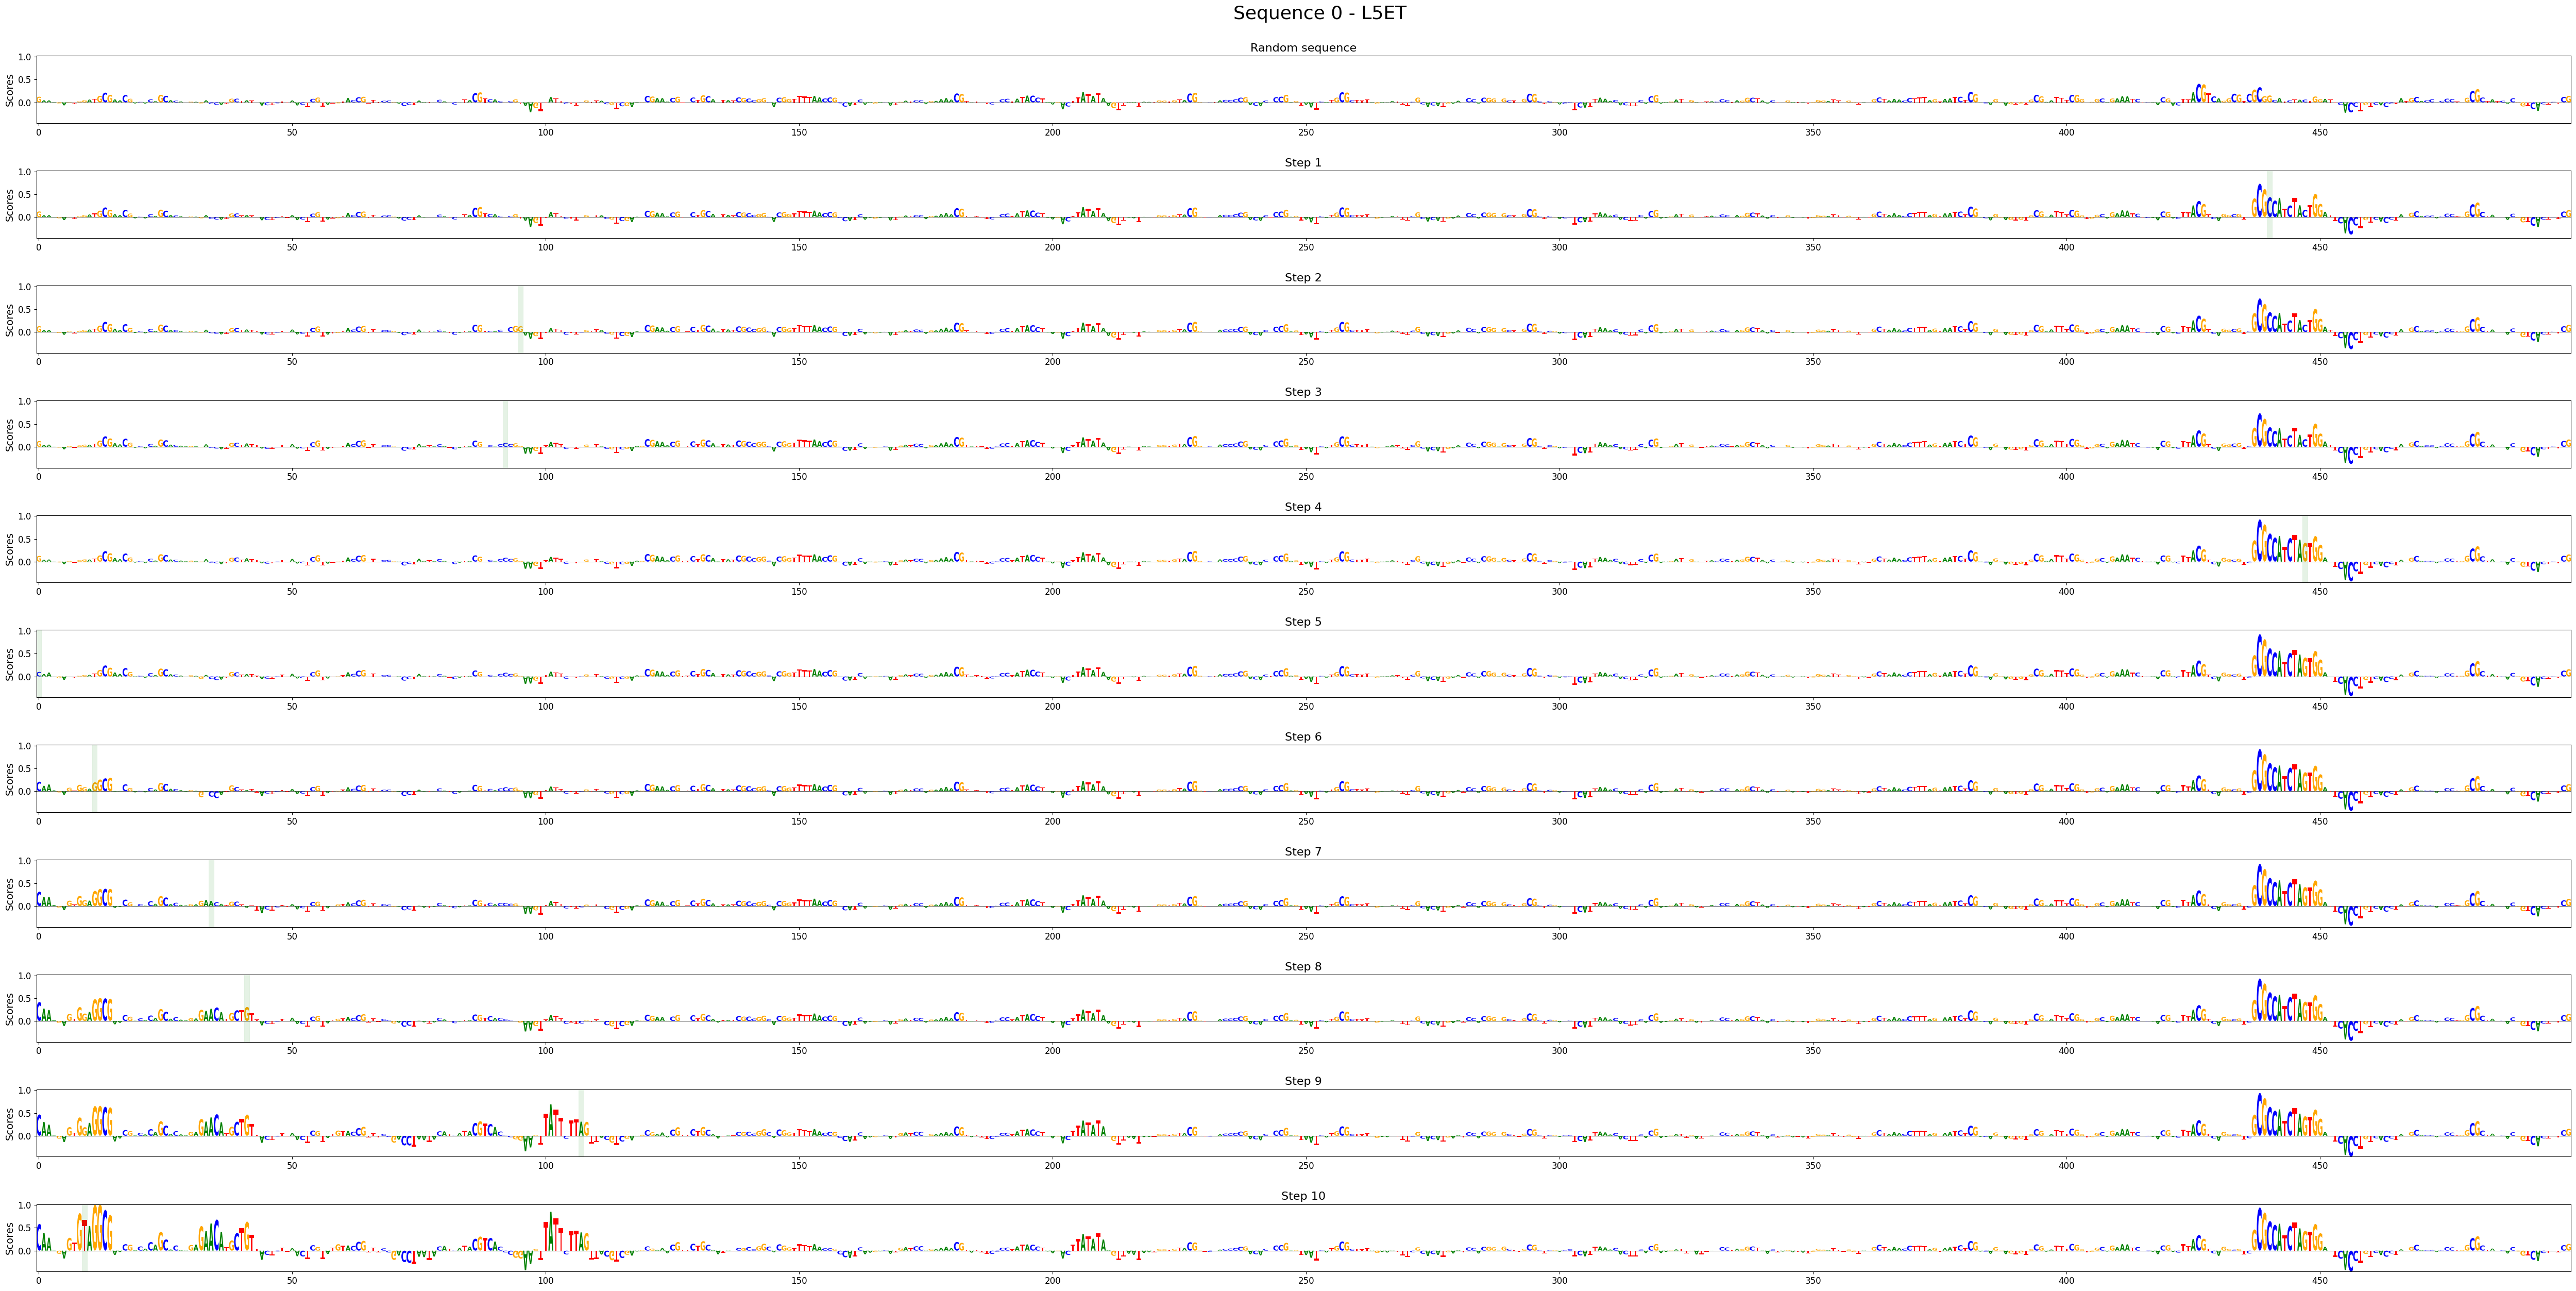
Visualize enhancer design stepwise contribution scores.
Contribution scores can be calculated using the
contribution_scores()method.- Parameters:
intermediate (
list[dict] |dict) – Intermediate output from enhancer design when return_intermediate is True. Specifically, a single dict or list of dicts (one per designed sequence), with dict entry ‘changes’ to denote the changed position per step.scores_all (
list[ndarray] |ndarray) – A list of contribution scores arrays for each designed sequence, of shape [(seq_steps, n_classes, n_bases, n_features), …], like fromcontribution_scores().seqs_one_hot_all (
list[ndarray] |ndarray) – A list of one-hot encoded corresponding sequence arrays of shape [(seq_steps, n_bases, n_features), …], like fromderive_intermediate_sequences().sequence_labels (
list|None(default:None)) – List of sequence labels ot add to the plot. Should have the same length as the number of designed sequences.class_labels (
list|None(default:None)) – List of class labels to add to the plot. Should have the same length as the number of classes.zoom_n_bases (
int|None(default:None)) – Number of center bases to zoom in on. Default is None (no zooming).ylim (
tuple[float,float] |None(default:None)) – Y-axis limits, ignored if global_ylim is set. Default is None.global_ylim (
Optional[Literal['all','per_design','per_plot']] (default:'per_plot')) – Used to set global y-axis limits across explanations. Can be one of ‘all’, ‘per_design’, ‘per_plot’ or None. Default is ‘per_plot’ ‘all’ makes the y-axis limit same across all of the explanations. ‘per_design’ makes the y-axis limit same across all of the steps and classes of a single designed sequence. ‘per_plot’ makes y-axis limits same across all the steps but not the classes of a single designed sequence. If None, each explanation has its y-axis limits separately selected.method (
Optional[Literal['mutagenesis','mutagenesis_letters']] (default:None)) – Default is None (for gradient-based contributions). If plotting mutagenesis values, set to'mutagenesis_letters'(to visualize average effects as letters) ormutagenesis(to visualize in a legacy way).highlight_kws (
dict|None(default:None)) – Keywords to use for plotting changed basepairs withaxvspan(). Default is {‘edgecolor’: “red”, ‘facecolor’: “none”, ‘linewidth’ :0.5}show (
bool(default:True)) – Whether to show all plots or return the (list of) figure and axes instead.width – Width of each created figure. Default is 50.
height – Height of each created figure. Default is 2*`n_seqs`.
sharex – Whether to share the x axes of the created subplots within each figure. Default is False.
sharey – Whether to share the y axes of the created subplots within each figure. Default is False.
save_path – If provided, where to save the figure(s). If more than one plot is created (like with multiple sequences and/or multiple classes), will append _1/_2/… to the filename.
kwargs – Additional arguments passed to
contribution_scores()to control contribution score settings and on torender_plot()to control the final plot output. Please seecontribution_scores()andrender_plot()for details. Custom defaults forenhancer_design_steps_contribution_scores:suptitle_fontsize=26,tight_rect=[0, 0, 1, 0.98].
- Return type:
tuple[Figure,list[Axes]] |list[tuple[Figure,list[Axes]]] |None- Returns:
If
show=False, a (fig, axs) tuple (if plotting one sequence and one class), or a list of (fig, axs) tuples (if plotting multiple sequences and/or classes).
Example
>>> crested.pl.design.step_contribution_scores(
...     intermediate_results,
...     scores,
...     one_hot_encoded_sequences,
...     class_labels=["L5ET"],
...     highlight_kws={'facecolor': 'green', 'edgecolor': 'green', 'alpha': 0.1},
... )