crested.pl.design.step_predictions#
- crested.pl.design.step_predictions(intermediate, target_classes, obs_names, separate=False, n_rows=None, n_cols=None, legend_separate=False, plot_color=(0.3, 0.5, 0.6), fig_rescale=1.0, plot_kws=None, ax=None, **kwargs)#
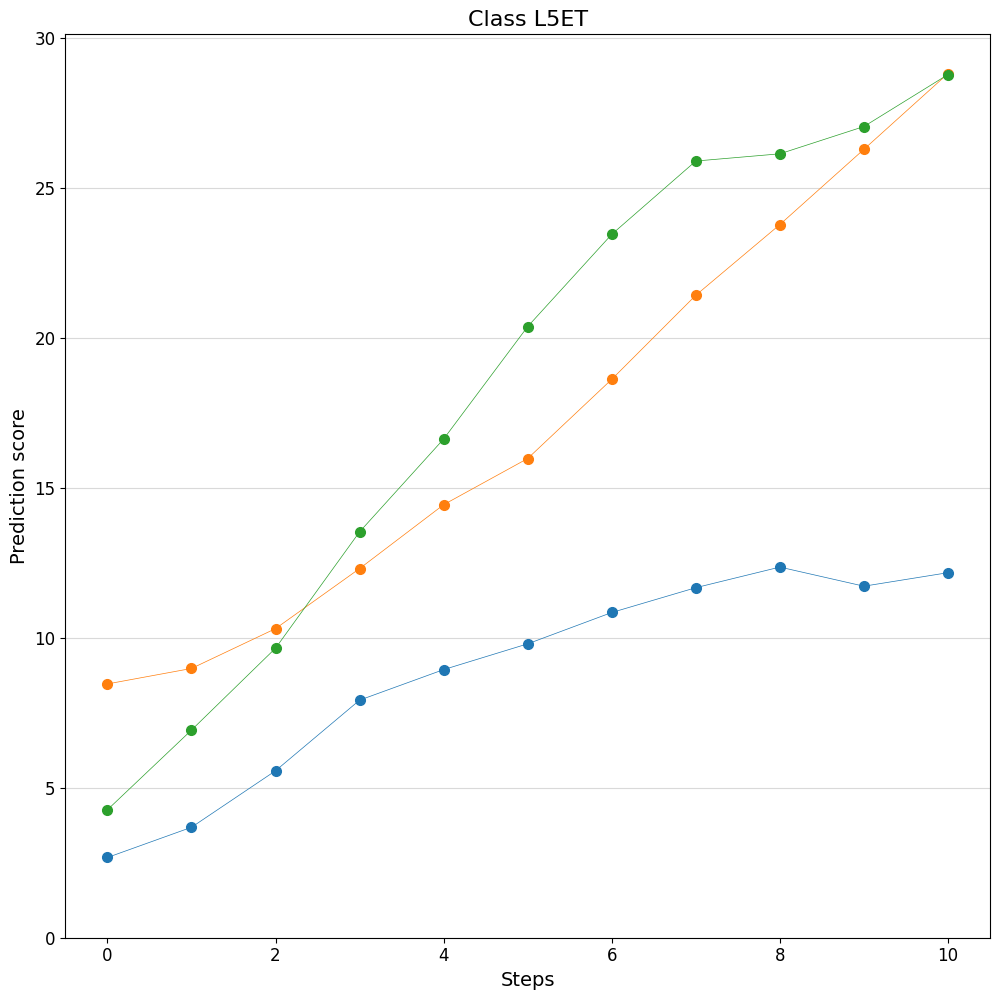
Visualize enhancer design prediction score progression.
- Parameters:
intermediate (
list[dict]) – Intermediate output from enhancer design when return_intermediate is Truetarget_classes (
str|list[str]) – Target classes that the predictions will be plotted for. All target classes must be in obs_names.obs_names (
Index|list[str]) – All class names either in the form of AnnData.obs_names or as a list.separate (
bool(default:False)) – Whether to plot each designed enhancer separately, or all together as a boxplot. Default is False.n_rows (
int|None(default:None)) – Number of rows to use when more than one target class is selected. If None, will infer fromn_cols. If both are None, creates a square grid.n_cols (
int|None(default:None)) – Number of columns to use when more than one target class is selected. If None, will infer fromn_rows. If both are None, creates a square grid.legend_separate (
bool(default:False)) – Whether to plot a legend when separate is True. Default is False.plot_color (
str|tuple(default:(0.3, 0.5, 0.6))) – Boxplot color when separate is False. Default is (0.3, 0.5, 0.6).fig_rescale (
float(default:1.0)) – A scalar to scale the figure size up or down. Default is 1.0.plot_kws (
dict|None(default:None)) – Extra keyword arguments passed toplot()(ifseparate=True)/boxplot()(ifseparate=False). Defaults:separate=True:{'marker': "o",'markersize': 7, 'linewidth': 0.5}separate=False:{"showfliers": False, "capprops"/"boxprops"/"whiskerprops"/"flierprops"/"medianprops"/"meanprops": {"color": plot_color}}ax (
Axes|None(default:None)) – Axis to plot values on. If not supplied, creates a figure from scratch.width – Width of the newly created figure if not supplying
ax. Default isfig_rescale`*7*`n_rows.height – Height of the newly created figure if not supplying
ax. Default isfig_rescale`*7*`n_cols.sharex – Whether to share the x axes of the created plots. Default is False.
sharey – Whether to share the y axes of the created plots. Default is True.
kwargs – Additional arguments passed to
render_plot()to control the final plot output. Please seerender_plot()for details.
- Return type:
See also
Example
>>> crested.pl.design.step_predictions(
...     intermediate_results,
...     target_classes="L5ET",
...     obs_names=adata.obs_names,
...     separate=True,
... )