crested.pl.dist.histogram#
- crested.pl.dist.histogram(adata, model_name='truth', class_names=None, split=None, log_transform=True, plot_kws=None, ax=None, target='deprecated', **kwargs)#
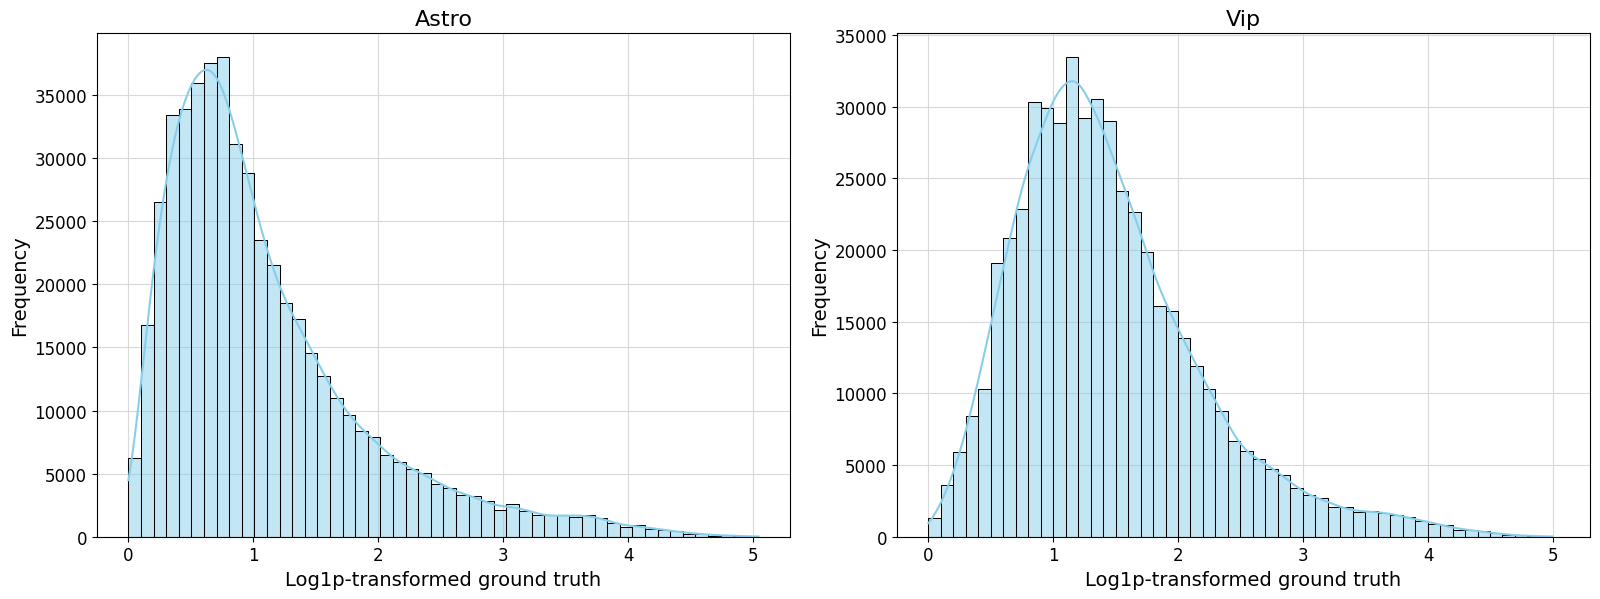
Histogram of region distribution for specified classes.
- Parameters:
adata (
AnnData) – AnnData object containing the predictions inlayers.model_name (
str(default:'truth')) – The target to plot the distribution for, either ‘X’/’truth’/’groundtruth’/None (for the ground truth) or the name of a prediction layer in adata.layers.class_names (
list[str] |None(default:None)) – Single class name or list of classes inadata.obs. If None, will create a plot per class inadata.obs.split (
str|None(default:None)) – ‘train’, ‘val’, ‘test’ subset or None. If None, will use all splits. If not None, expects a “split” column in adata.var.log_transform (
bool(default:True)) – Whether to log-transform the data before plotting.plot_kws (
dict|None(default:None)) – Extra keyword arguments passed tohistplot(). Defaults:{'kde': True, 'stat': 'frequency', 'color': 'skyblue', 'binwidth': np.ptp(data)}.ax (
Axes|None(default:None)) – Axis to plot values on. If not supplied, creates a figure from scratch. Can only be supplied if plotting a single model.width – Width of the newly created figure if
ax=None. Default is 8 per class histogram.height – Height of the newly created figure if
ax=None. Default is 6 per class histogram.sharex – Whether to share the x axes of the created plots. Default is True.
sharey – Whether to share the y axes of the created plots. Default is True.
kwargs – Additional arguments passed to
render_plot()to control the final plot output. Please seerender_plot()for details. Custom defaults fordistribution:grid='both'.
- Return type:
See also
Example
>>> crested.pl.dist.histogram(
...     adata,
...     split="test",
...     sharey=False,
...     class_names=["Astro", "Vip"]
... )