crested.pl.qc.filter_cutoff#
- crested.pl.qc.filter_cutoff(adata, cutoffs=(1.5, 1, 0.5, 0), model_name=None, color_points=True, double_y_axis=True, line_cmap='tab10', plot_kws=None, line_kws=None, ax=None, **kwargs)#
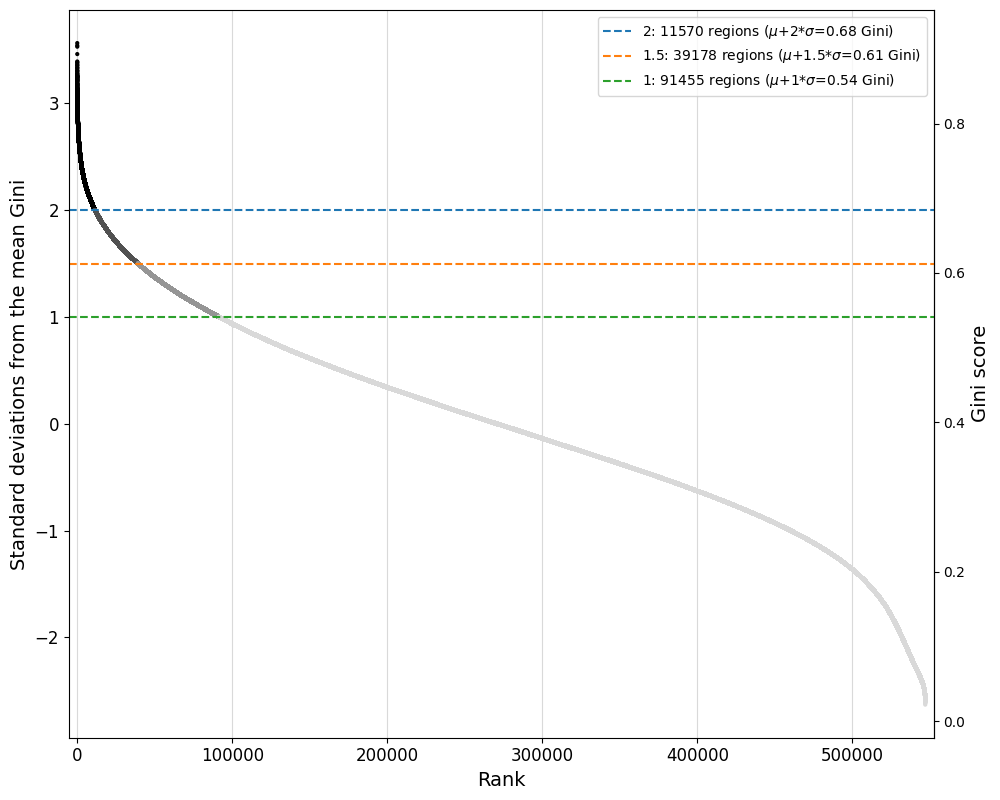
Plot the effect of different potential filtering cutoffs in
filter_regions_on_specificity()before doing the filtering.If the default cutoff (1 standard deviation above the mean) is too stringent or too lenient, try different cutoffs and pick the best one.
- Parameters:
adata (AnnData) – AnnData object with region data. This should not be filtered yet!
cutoffs (Sequence (default:
(1.5, 1, 0.5, 0))) – List of considered gini standard deviation cutoffs to plot, as infilter_regions_on_specificity()’sgini_std_threshold(where the default is 1).model_name (str | None (default:
None)) – The name of the model to calculate scores from. If None or ‘truth’/’groundtruth’/’X’ (default), will use the values in adata.X.color_points (bool (default:
True)) – Whether to color the region points according to their position inside/outside the different cutoffs. If True (default), adds'c': cutoff_index,'cmap': 'Greys'and'vmin': 0toplot_kws(unless manually specified).double_y_axis (bool (default:
True)) – Whether to add a secondary y axis on the right side showing the Gini scores, augmenting the default axis showing standard deviations from the Gini mean.line_cmap (str | Sequence (default:
'tab10')) – Colors or colormap to draw colors for the differentcutoffslines from. Any valid input tocolor_palette()works. Examples are a matplotlib or seaborn colormap name or a list of colors.plot_kws (dict | None (default:
None)) – Extra keyword arguments passed toscatter(). Defaults:'s': 4.line_kws (dict | None (default:
None)) – Extra keyword arguments passed toaxvline(). Defaults:'linestyle': '--'.ax (plt.Axes | None (default:
None)) – Axis to plot values on. If not supplied, creates a figure from scratch.width – Width of the newly created figure if
ax=None. Default is 8.height – Height of the newly created figure if
ax=None. Default is 6.kwargs – Additional arguments passed to
render_plot()to control the final plot output. Please seerender_plot()for details. Custom defaults forgini_filtering:xlabel='Rank',ylabel='Standard deviations from the mean Gini',grid='x'.
- Return type:
(plt.Figure, plt.Axes) | None
Example
>>> crested.pl.qc.filter_cutoff(adata, cutoffs=[2, 1.5, 1])