crested.pl.locus.track#
- crested.pl.locus.track(scores, class_idxs=None, zoom_n_bases=None, coordinates=None, class_names=None, highlight_positions=None, plot_kws=None, highlight_kws=None, ax=None, range='deprecated', **kwargs)#
Plot a predicted locus track, like a Borzoi prediction or BigWig track.
- Parameters:
scores (
ndarray) – A numpy array of heights along the track. Can be shapes (length) or (length, classes), and will automatically squeeze out one-wide dimensions.class_idxs (
int|list[int] |None(default:None)) – Index or list of indices denoting classes to plot. If None, plots all classes.zoom_n_bases (
int|None(default:None)) – Number of center bases/bins to zoom in on. Default is None (no zooming).coordinates (
str|tuple|None(default:None)) – Optional, a string or tuple of coordinates that are being plotted between, to set the x coordinates. Can be a parsable chr:start-region(:strand) string, or a tuple with ((chr), start, end, (strand)), with chr and strand being optional. If strand is provided and ‘-’, runs the x coordinates from end to start.class_names (
Sequence[str] |str|None(default:None)) – Optional, list of all possible class names to extract label names from. If class_idxs is supplied, picks from there. If not, will use these in order.highlight_positions (
list[tuple[int,int]] |None(default:None)) – A list of tuples specifying ranges to highlight on the plot.plot_kws (
dict|None(default:None)) – Extra keyword arguments passed tofill_between().highlight_kws (
dict|None(default:None)) – Keywords to use for plotting highlights withaxvspan(). Default is {‘color’: “green”, ‘alpha’: 0.1}ax (
Axes|None(default:None)) – Axis to plot values on. If not supplied, creates a figure from scratch.width – Width of the newly created figure if
ax=None. Default is 20.height – Height of the newly created figure if
ax=None. Default is 3 per class.sharex – Whether to share the y axes of the created plots. Default is False
sharey – Whether to share the y axes of the created plots. Default is True.
kwargs – Additional arguments passed to
render_plot()to control the final plot output. Please seerender_plot()for details. Custom defaults fortrack:xlabel=f"{chr}:{start:,.0f}-{end:,.0f} ({end - start} bp)", (ifcoordinatesis set),title=class_names[class_idxs](ifclass_namesis set)
- Return type:
Example
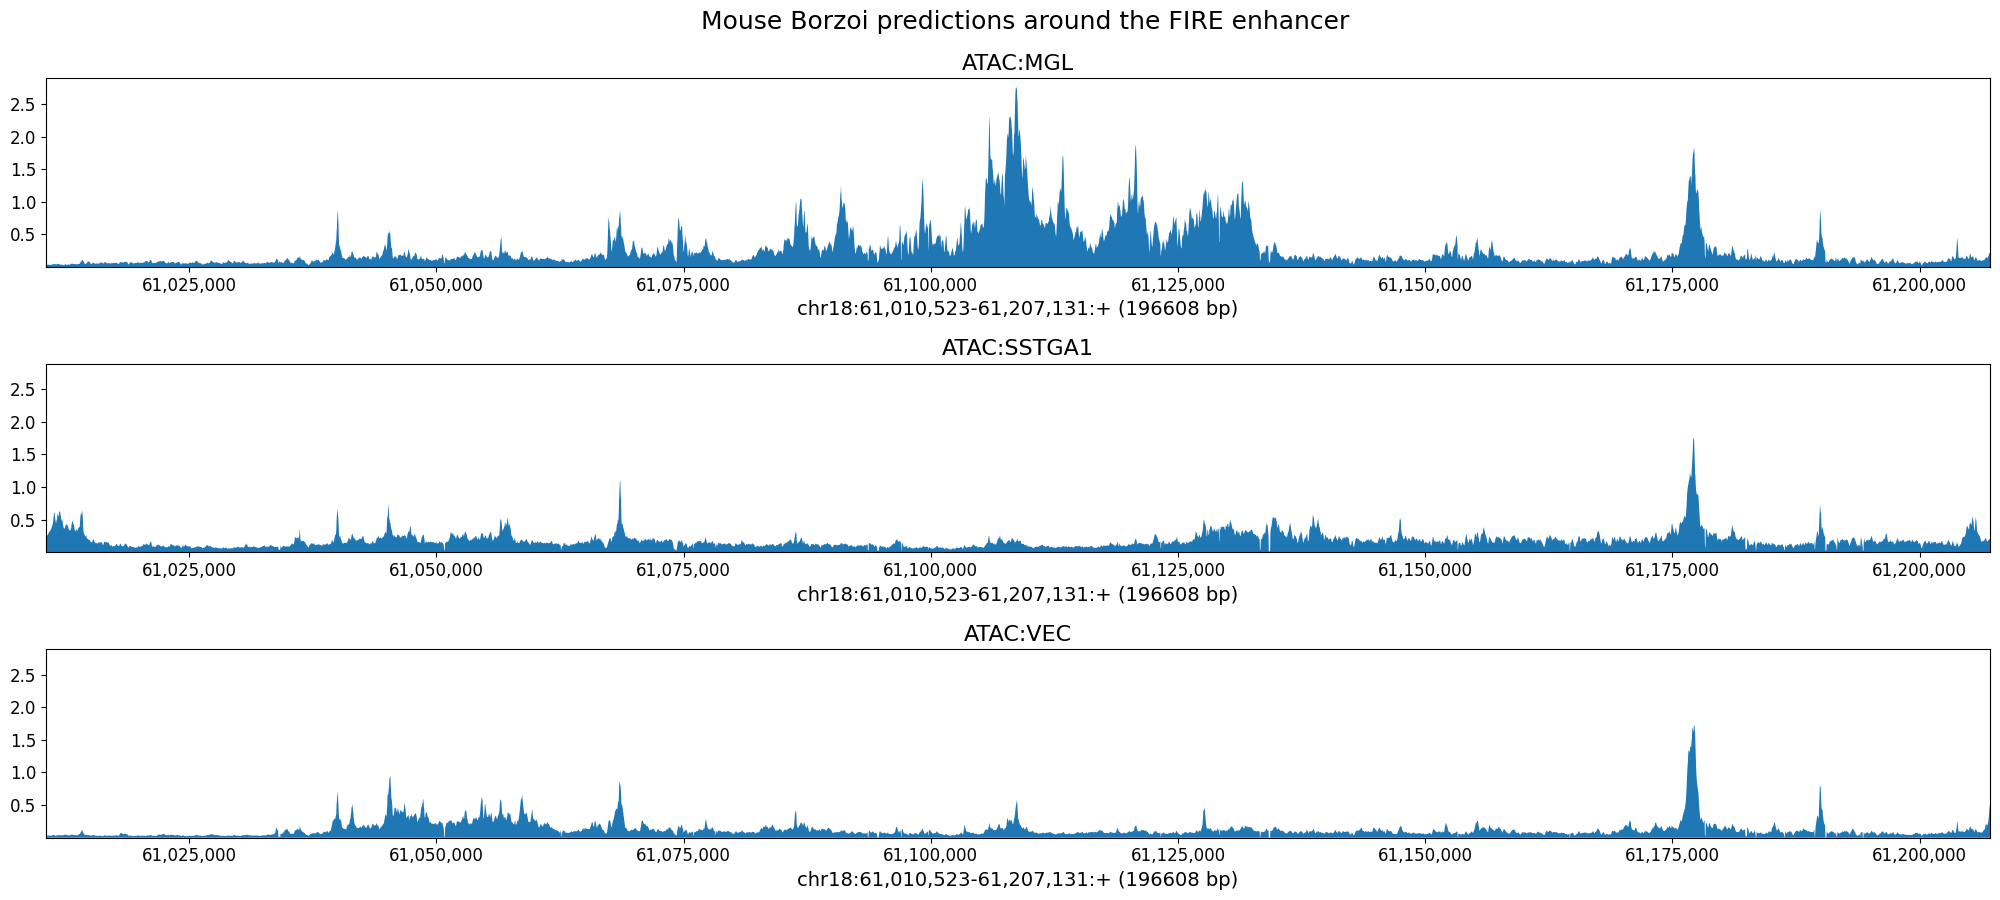
>>> chrom, start, end = 'chr18', 61010523, 61207131
>>> class_idxs = [output_names_borzoi.index(class_name) for class_name in ['ATAC:MGL', 'ATAC:SSTGA1', 'ATAC:VEC']]
>>> crested.pl.locus.track(
...     borzoi_pred,
...     class_idxs=class_idxs,
...     class_names=output_names_borzoi,
...     coordinates=(chrom, start, end),
...     suptitle="Mouse Borzoi predictions around the FIRE enhancer",
... )
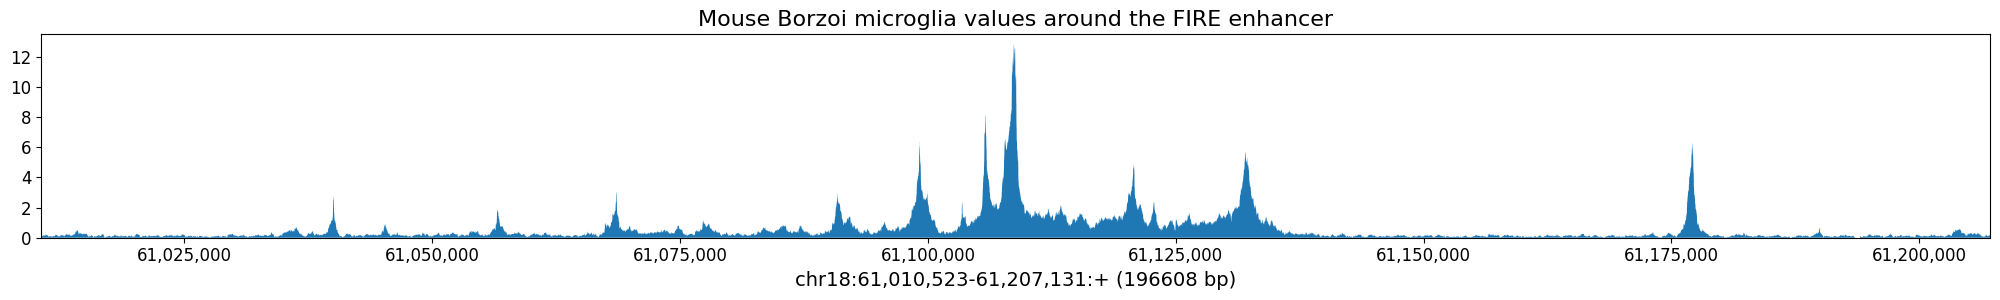
>>> bw_values, midpoints = crested.utils.read_bigwig_region(bw_path, (chrom, start, end))
>>> crested.pl.locus.track(
...     bw_values,
...     coordinates=(chrom, start, end),
...     title="Mouse Borzoi microglia values around the FIRE enhancer",
... )