crested.pl.corr.scatter#
- crested.pl.corr.scatter(adata, class_name=None, model_names=None, split='test', log_transform=False, exclude_zeros=True, density_indication=False, square=False, identity_line=False, cbar=False, downsample_density=10000, max_threads=8, plot_kws=None, cbar_kws=None, ax=None, **kwargs)#
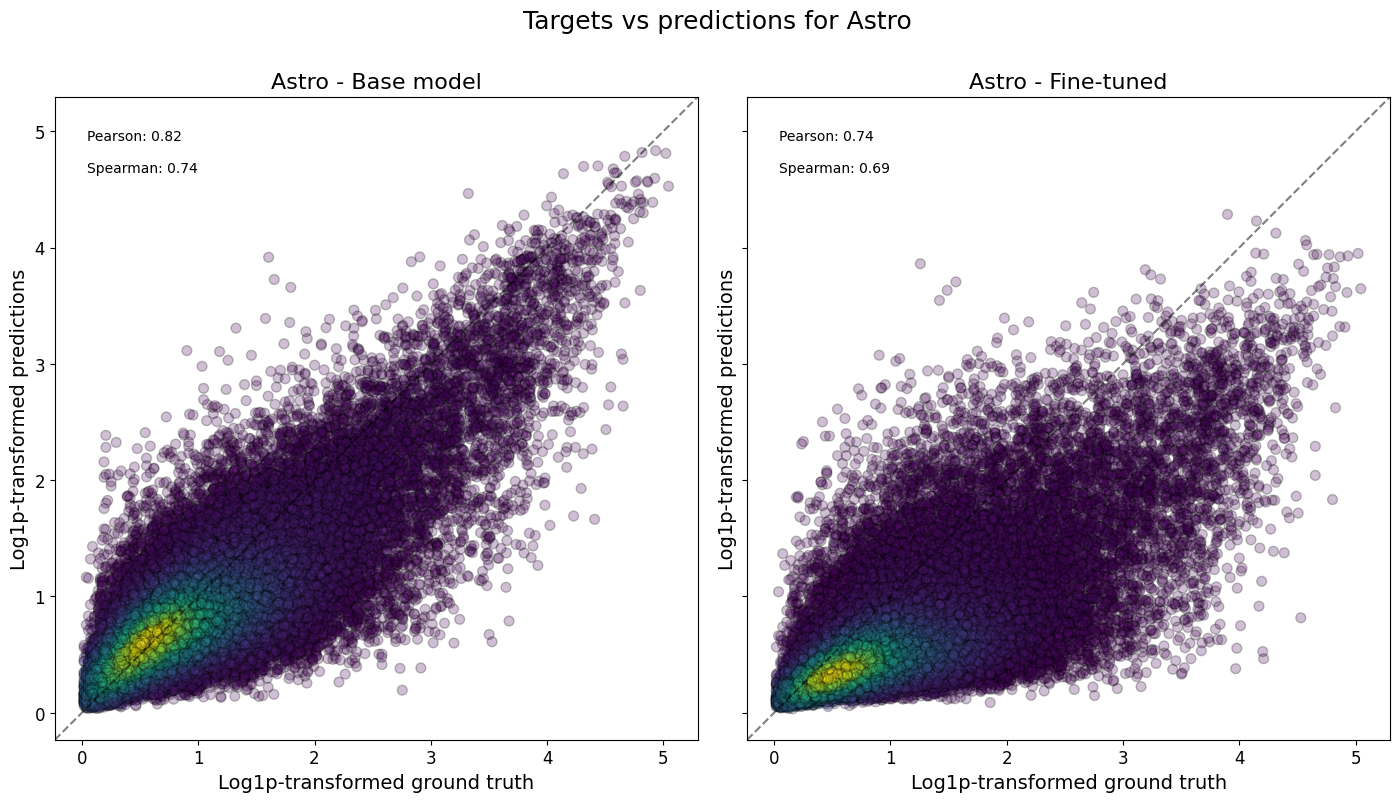
Plot a density scatter plot of predictions vs ground truth for specified models and class.
- Parameters:
adata (
AnnData) – AnnData object containing the data inXand predictions inlayers.class_name (
str|None(default:None)) – Name of the class inadata.obs_names. If None, plot is made for all the classes.model_names (
str|list[str] |None(default:None)) – Model name or list of model names inadata.layers. If None, will create a plot per model inadata.layers.split (
str|None(default:'test')) – ‘train’, ‘val’, ‘test’ subset or None. If None, will use all splits. If not None, expects a “split” column in adata.var.log_transform (
bool(default:False)) – Whether to log-transform the data before plotting.exclude_zeros (
bool(default:True)) – Whether to exclude zero ground truth values from the plot.density_indication (
bool(default:False)) – Whether to indicate density in the scatter plot.square (
bool(default:False)) – Whether to force the plots to be square, have equal aspect ratios, and equal shared axis ranges.identity_line (
bool(default:False)) – Whether to plot a y=x line denoting perfect correlation.cbar (
bool(default:False)) – Whether to plot the colorbar when usingdensity_indication.downsample_density (
int(default:10000)) – Number of points to downsample to when fitting the density if using the density indication. Note that one point denotes one region for one class, so the full set would be # of (test) regions * # classes. Default is 10000. If False, will not downsample.max_threads (
int(default:8)) – Maximum number of threads to use when evaluating the density if using the density indication. If 1, will not parallelize.plot_kws (
dict|None(default:None)) – Extra keyword arguments passed toscatter(). Defaults:{'alpha': 0.25, 'edgecolor': 'k'}.cbar_kws (
dict|None(default:None)) – Extra keyworde arguments passed tocolorbar(). Defaults:{'label': 'Density', 'shrink': 0.8}ax (
Axes|None(default:None)) – Axis to plot values on. If not supplied, creates a figure from scratch.width – Width of the newly created figure if
ax=None. Default is 7 per model withoutcbar, or 8 withcbar.height – Height of the newly created figure if
ax=None. Default is 8.sharex – Whether to share the x axes of the created plots. Default is False. Setting
square=Truedoes equalize limits even ifsharex=Falsesharey – Whether to share the y axes of the created plots. Default is True. Setting
square=Truedoes equalize limits even ifsharey=Falsekwargs – Additional arguments passed to
render_plot()to control the final plot output. Please seerender_plot()for details. Custom defaults forclass_density:xlabel="Ground truth",ylabel='Predictions',alpha='0.25',title=({class_name} - ){model_name},suptitle='Targets vs predictions (for {class_name})'(if n_models>1).
- Return type:
See also
Example
>>> crested.pl.corr.scatter(
...     adata,
...     class_name="Astro",
...     model_names=["Base model", "Fine-tuned"],
...     split="test",
...     log_transform=True,
...     density_indication=True,
...     square=True,
...     identity_line=True,
...     save_path="temp_figs/corr_scatter.png"
... )