crested.pl.corr.violin#
- crested.pl.corr.violin(adata, model_names=None, split='test', log_transform=False, plot_kws=None, ax=None, **kwargs)#
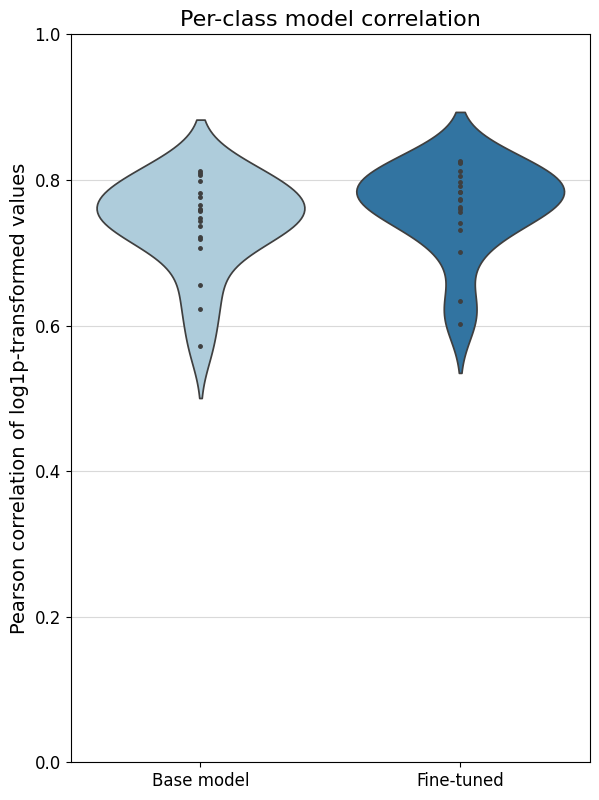
Plot correlation violinplots of predictions vs ground truth for different cell types.
Calculates correlations over cell types, i.e. for each cell type, calculates the correlation between ground truth and predictions across all regions.
- Parameters:
adata (
AnnData) – AnnData object containing the data inXand predictions inlayers.model_names (
str|list[str] |None(default:None)) – Model name or list of model names (adata.layers) to use to calculate correlations with ground truths. Default is to plot all models inadata.layers.split (
str|None(default:'test')) – ‘train’, ‘val’, ‘test’ subset or None. If None, will use all targets. If not None, expects a “split” column in adata.var.log_transform (
bool(default:False)) – Whether to log-transform the data before calculating correlations.plot_kws (
dict|None(default:None)) – Extra keyword arguments passed toviolinplot(). Defaults:{'inner': 'point', 'orient': 'v'}.ax (
Axes|None(default:None)) – Axis to plot values on. If not supplied, creates a figure from scratch.width – Width of the newly created figure if
ax=None. Default width is 6, +1 for every model > 5.height – Height of the newly created figure if
ax=None. Default is 8.kwargs – Additional arguments passed to
render_plot()to control the final plot output. Please seerender_plot()for details. Custom defaults forcorrelations:ylabel='Pearson correlation',grid='y',ylim=(0.0, 1.0),title="Class-wise prediction vs ground truth correlations",xtick_rotation=55(if any model_names > 15 characters).
- Return type:
Examples
>>> crested.pl.corr.violin(
...     adata_specific,
...     model_names=["Base model", "Fine-tuned"],
...     split="test",
...     log_transform=True,
...     plot_kws={'palette': 'Paired', 'order': ["Base model", "Fine-tuned"]},
...     title="Per-class model correlation",
... )