crested.pl.qc.normalization_weights#
- crested.pl.qc.normalization_weights(adata, plot_kws=None, ax=None, **kwargs)#
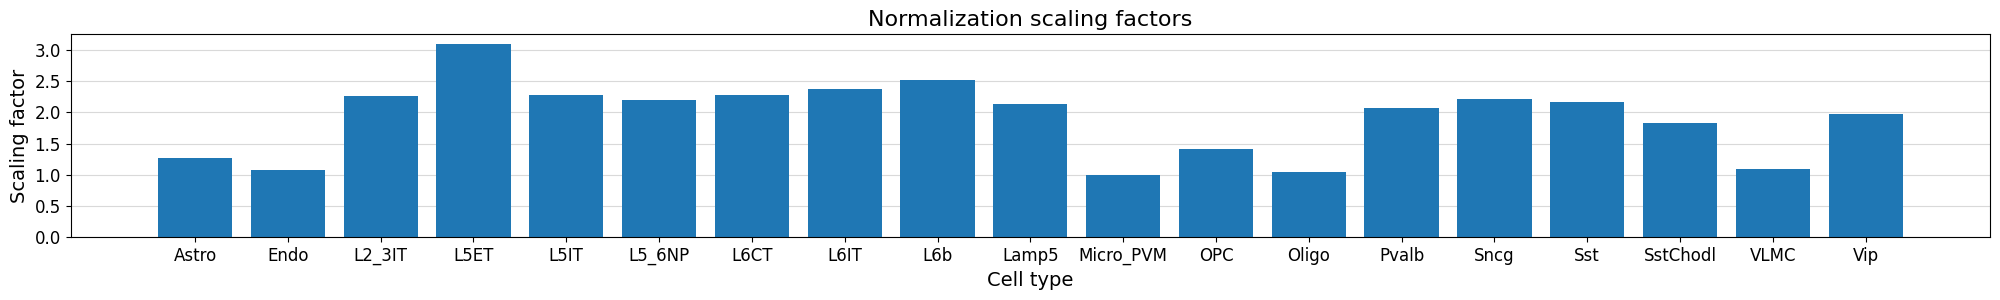
Plot the distribution of normalization scaling factors per cell type after running
normalize_peaks().- Parameters:
adata (
AnnData) – AnnData object containing the normalization weights inobsm["weights"].plot_kws (
dict|None(default:None)) – Extra keyword arguments passed tobar().ax (
Axes|None(default:None)) – Axis to plot values on. If not supplied, creates a figure from scratch.width – Width of the newly created figure if
ax=None. Default is 20.height – Height of the newly created figure if
ax=None. Default is 5.kwargs – Additional arguments passed to
render_plot()to control the final plot output. Please seerender_plot()for details. Custom defaults fornormalization_weights:xlabel="Cell type",ylabel="Scaling factor",grid='y'.
- Return type:
Example
>>> crested.pl.qc.normalization_weights(
...     adata,
...     width=20,
...     height=3,
...     title="Normalization scaling factors",
... )